Wankhede Stadium has served as a primary IPL venue since 2008, hosting 125 matches across multiple seasons.
This reference guide compiles verified statistical records from all IPL fixtures played at the venue.
Data includes batting aggregates, bowling returns, team totals, and fielding contributions.
The Wankhede Stadium IPL records presented here draw from official match scorecards and tournament archives.
Each section provides standalone statistical tables without interpretive analysis.
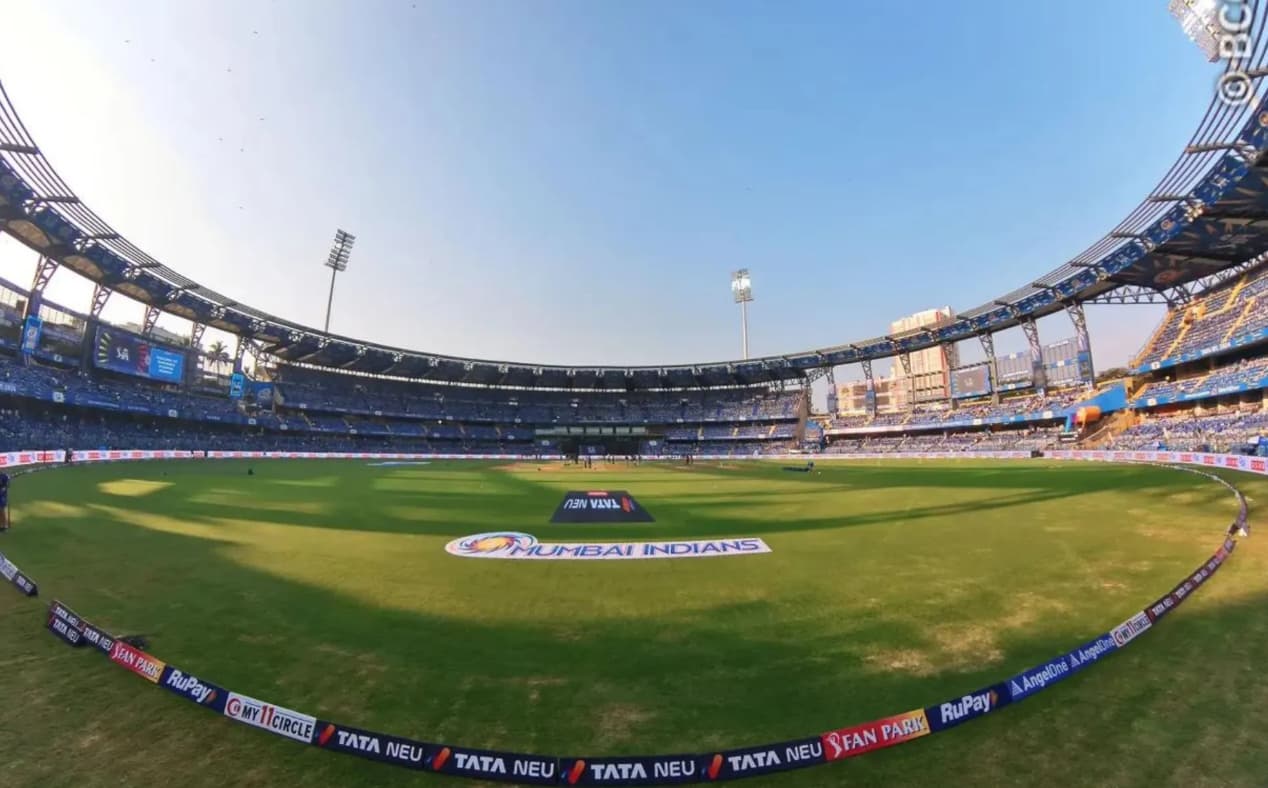
Wankhede Stadium IPL Records, Stats & Pitch Report
This format supports quick verification of player performances, team benchmarks, and venue-specific trends across IPL history.
Wankhede Stadium IPL Records
| Parameter | Details |
|---|---|
| Established | 1974 |
| Location | Churchgate, Mumbai |
| Capacity | 33,100 |
| Total IPL Matches | 125 |
| First IPL Match | April 20, 2008 |
| Highest Team Score | 235/1 by RCB |
| Lowest Team Score | 67 all out by KKR |
Batting Output at Wankhede Stadium
The Wankhede Stadium IPL Stats reflect accumulated performances across 125 matches spanning multiple IPL seasons. Individual batting records include run aggregates, single-innings peaks, boundary distribution, and strike rate efficiency metrics.
Leading Run Accumulators
Career run totals show Mumbai Indians players dominating due to home venue frequency.
| Player | Runs |
|---|---|
| Rohit Sharma | 2451 |
| Suryakumar Yadav | 1395 |
| Kieron Pollard | 1226 |
| Ambati Rayudu | 1008 |
| Dinesh Karthik | 855 |
Single-Innings Batting Benchmarks
AB de Villiers’ 133* represents the highest individual score recorded at this venue.
| Player | Score |
|---|---|
| AB de Villiers | 133* |
| Yashasvi Jaiswal | 124 |
| Virender Sehwag | 122 |
| Sanju Samson | 119 |
| Shane Watson | 117* |
Boundary Distribution – Sixes
Six-hitting frequency reflects venue dimensions and boundary clearance patterns observed across IPL seasons.
| Player | Sixes |
|---|---|
| Rohit Sharma | 110 |
| Kieron Pollard | 85 |
| Suryakumar Yadav | 61 |
| Ambati Rayudu | 43 |
| Jos Buttler | 42 |
Boundary Distribution – Fours
Four-hitting totals indicate gap placement efficiency and outfield pace utilization across career innings.
| Player | Fours |
|---|---|
| Rohit Sharma | 226 |
| Suryakumar Yadav | 158 |
| Sachin Tendulkar | 94 |
| Dinesh Karthik | 92 |
| Ambati Rayudu | 91 |
Strike Rate Efficiency
The Wankhede Stadium IPL records t20 format produces elevated strike rates among lower-order batters and designated power hitters.
| Player | Strike Rate |
|---|---|
| Pravin Mankad | 400.0 |
| Sachin Chitnis | 250.0 |
| Jitesh Sharma | 239.2 |
| Romario Shepherd | 239.2 |
| A Khan | 233.3 |
Bowling Performance Summary
The Wankhede Stadium Pitch Report conditions typically favor batting, though specialized bowlers have achieved significant wicket returns through pace variations and yorker execution.
| Category | Leader | Figure |
|---|---|---|
| Most Wickets | Lasith Malinga | 68 |
| Best Bowling Figures | Harbhajan Singh / Wanindu Hasaranga | 5/18 |
| Most Economical Spell | Deepak Chahar | 4/13 |
Wicket-Taking Leaders
The wankhede stadium most wickets in ipl category, showing Lasith Malinga’s 68 dismissals, representing the highest venue-specific total by any IPL bowler.
| Player | Wickets |
|---|---|
| Lasith Malinga | 68 |
| Jasprit Bumrah | 64 |
| Harbhajan Singh | 49 |
| Mitchell McClenaghan | 37 |
| Hardik Pandya | 35 |
Best Match Bowling Returns
Five-wicket hauls at Wankhede require containment strategies against aggressive batting approaches on flat pitch surfaces.
| Player | Figures |
|---|---|
| Harbhajan Singh | 5/18 |
| Wanindu Hasaranga | 5/18 |
| Jasprit Bumrah | 5/21 |
| Umran Malik | 5/25 |
| Deepak Chahar | 4/13 |
Match-Level Records
The Wankhede Stadium IPL scorecard archive documents extreme scoring ranges from 235 (highest) to 67 (lowest), indicating variable match conditions and bowling execution quality.
Highest Team Totals
The wankhede stadium highest score chase in ipl remains challenging despite favorable batting conditions and compact venue dimensions.
| Match | Score |
|---|---|
| RCB vs MI | 235/1 by RCB |
| MI vs DC | 234/5 by MI |
| MI vs PBKS | 230/3 by PBKS |
| PBKS vs CSK | 226/6 by PBKS |
| DC vs RR | 222/2 by RR |
Lowest Team Totals
Batting collapses demonstrate pressure impact and bowling quality despite the venue’s reputation as batter-friendly.
| Match | Score |
|---|---|
| KKR vs MI | 67 all out by KKR |
| MI vs DC | 92 all out by MI |
| CSK vs MI | 97 all out by CSK |
| MI vs CSK | 100 all out by CSK |
| PBKS vs CSK | 106/8 by PBKS |
Fielding Contributions
Catch statistics reflect venue familiarity, with Mumbai Indians players recording the highest totals due to home match frequency.
| Player | Catches |
|---|---|
| Kieron Pollard | 40 |
| Rohit Sharma | 28 |
| Hardik Pandya | 25 |
| Dinesh Karthik | 23 |
| Ravindra Jadeja | 21 |
Conclusion:
The Wankhede Stadium records compiled here provide factual reference data for IPL statistical analysis and match preparation.
The Wankhede Stadium IPL records MI vs srh and other fixture-specific data show measurable performance variations based on team composition and match situations.
This reference archive documents 125 matches’ worth of verified statistics across batting, bowling, and fielding categories.
The Wankhede Stadium IPL pitch report characteristics remain consistent across seasons, producing quantifiable trends in scoring patterns and dismissal types.
- Run Environment: Scoring density at Wankhede averages significantly higher than IPL baseline metrics. Teams posting 200+ totals occur at an elevated frequency compared to other venues. Boundary percentages exceed league averages across both four and six categories.
- Bowling Difficulty: Wicket acquisition requires specialized skill execution under batting-favorable conditions. Economy rates trend higher than tournament averages. Five-wicket hauls remain statistically rare despite a 125-match sample size.
- Match Volatility: Score differentials between the highest and lowest team totals indicate extreme outcome variability. Batting collapses occur despite favorable pitch characteristics when pressure and quality bowling converge. Chase success rates vary significantly based on the first-innings total magnitude.