The Indian Premier League shows significant performance variation across franchises since its 2008 inception.
Win percentages, playoff qualification rates, and title counts reveal stark disparities between teams.
Several franchises maintain consistently poor records across multiple seasons.
These teams display recurring structural issues in squad composition, leadership stability, and strategic planning.
This analysis identifies the most unsuccessful ipl team in history using quantifiable metrics.
Data covers all seasons through IPL 2025 and focuses exclusively on active franchises.
Most Unsuccessful IPL Team in History
Most Unsuccessful Teams In IPL History
| Team | IPL Seasons | Matches Played | Wins | Losses | Championships |
|---|---|---|---|---|---|
| Delhi Capitals | 2008–2025 | 266 | 118 | 140 | 0 |
| Punjab Kings | 2008–2025 | 263 | 119 | 139 | 0 |
| Royal Challengers Bengaluru | 2008–2025 | 271 | 132 | 132 | 1 (2025) |
| Rajasthan Royals | 2008–2025 | 236 | 114 | 115 | 1 (2008) |
| Sunrisers Hyderabad | 2013–2025 | 196 | 93 | 98 | 1 (2016) |
List of the Most Unsuccessful Teams in IPL History
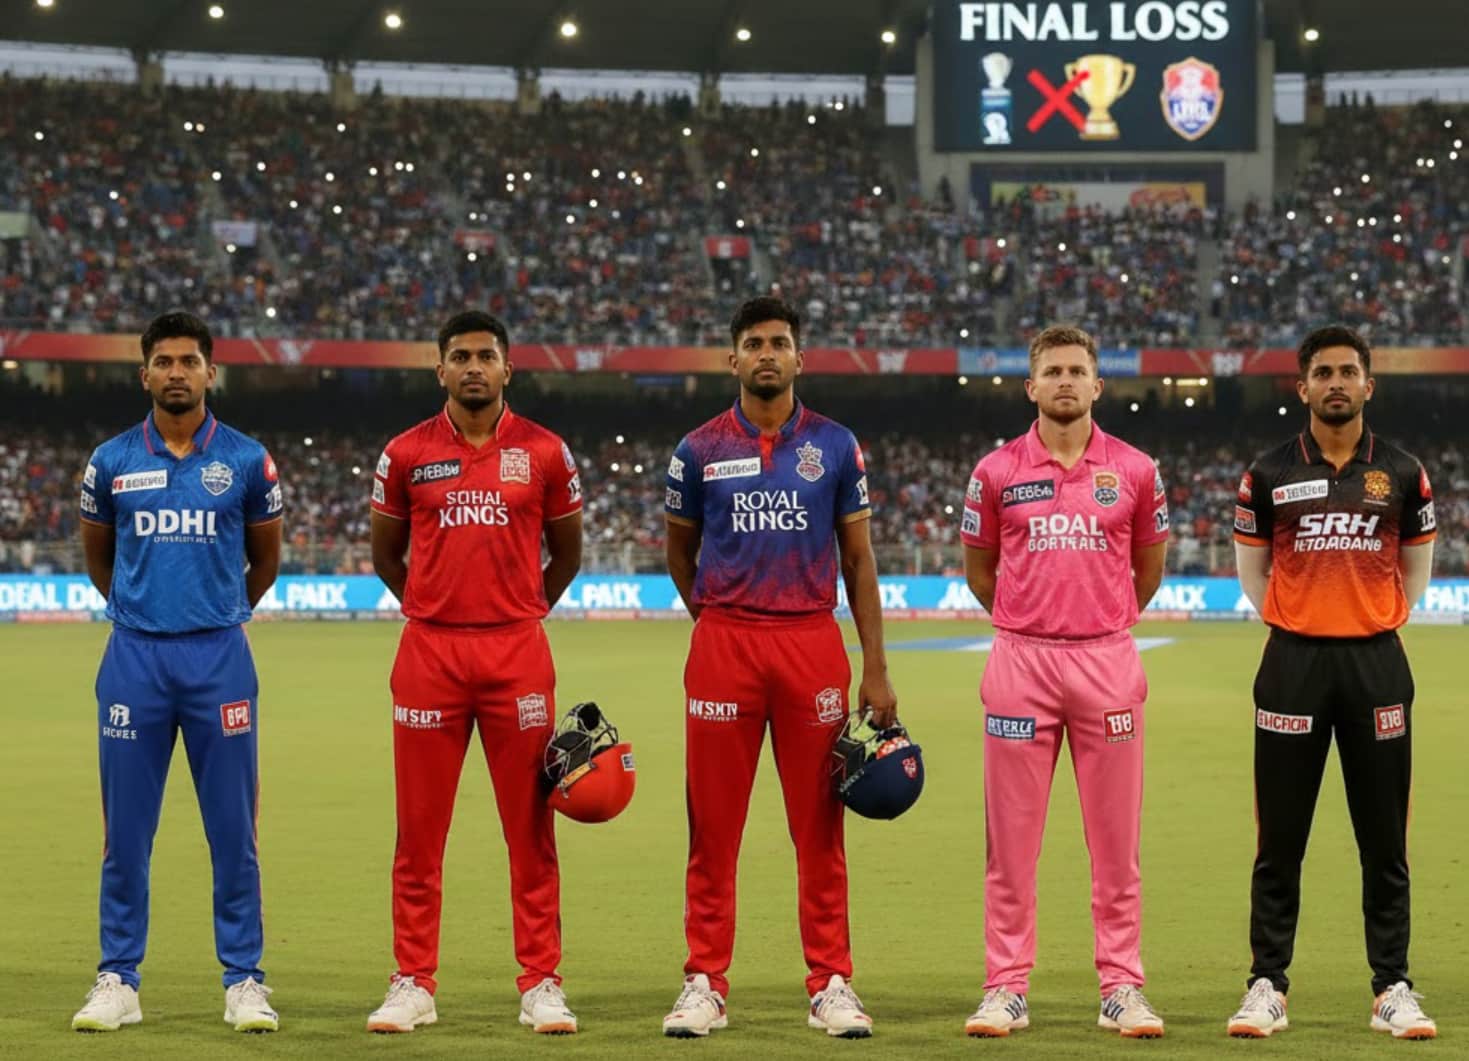
Delhi Capitals
Delhi Capitals record a 44.36% win rate across 266 matches. Zero championship wins despite 18 seasons of participation.
Playoff qualification: 5 consecutive misses between 2014 and 2018. Bottom-placed finishes in 2011 (4 wins) and 2013 (3 wins).
Player retention issues prevent core group formation. Leadership changes across coaching and captaincy roles exceed IPL averages.
Auction strategy shows inconsistent direction. Squad balance problems persist across multiple seasons without resolution.
Punjab Kings
Punjab Kings maintain 45.24% wins from 263 matches. Two final appearances (2014, 2025) without title conversion.
Squad composition lacks depth beyond the primary XI. Bowling attack repeatedly fails to defend competitive totals.
Dependency on individual performers creates vulnerability. When KL Rahul, Chris Gayle, or Glenn Maxwell underperform, team results collapse.
Retention policy prevents multi-season chemistry development. Overseas player slot changes disrupt established combinations yearly.
Royal Challengers Bengaluru
RCB held 48.70% win rate through 271 matches before the 2025 title. Three final losses (2009, 2011, 2016) preceded the championship.
Batting-heavy squad selection neglects bowling requirements. Death bowling failures cost multiple playoff opportunities.
Captaincy transitions failed to address tactical weaknesses. Pressure-situation performance remained below IPL standards.
2025 title win ended an 18-year drought. Historical data categorizes them among prolonged underperformers before a breakthrough.
Rajasthan Royals
Rajasthan Royals show 48.30% wins across 236 matches. Single title (2008) followed by a sustained decline.
Foreign player dependency limits domestic talent integration. Middle-order batting depth remains insufficient for playoff pressure.
Captaincy instability disrupts strategic continuity across seasons. Budget constraints result in weaker squad depth versus competitors.
Post-Warne era shows inability to replicate inaugural success formula. Playoff misses increased after the 2008 championship season.
Sunrisers Hyderabad
SRH posts 47.44% win rate from 196 matches. One title (2016) amid inconsistent overall performance.
The batting unit repeatedly underdelivers the target totals. Top-order dependency leaves the middle order unprepared for match situations.
Away match record indicates poor adaptability to venue variations. Tactical adjustments fail to counter opponent strategies effectively.
Post-2016 performance lacks championship-level consistency. Squad overhauls produce minimal improvement in results.
Win Percentages of All IPL Teams
| Team | IPL Span | Matches | Won | Lost | Win % | Loss % |
|---|---|---|---|---|---|---|
| Gujarat Titans | 2022–2025 | 60 | 37 | 23 | 61.66% | 38.33% |
| Chennai Super Kings | 2008–2025 | 253 | 142 | 108 | 56.12% | 42.68% |
| Mumbai Indians | 2008–2025 | 277 | 151 | 122 | 54.51% | 44.04% |
| Lucknow Super Giants | 2022–2025 | 58 | 30 | 27 | 51.72% | 46.55% |
| Kolkata Knight Riders | 2008–2025 | 265 | 135 | 124 | 50.94% | 46.79% |
| Royal Challengers Bengaluru | 2008–2025 | 271 | 132 | 132 | 48.70% | 48.70% |
| Rajasthan Royals | 2008–2025 | 236 | 114 | 115 | 48.30% | 48.72% |
| Sunrisers Hyderabad | 2013–2025 | 196 | 93 | 98 | 47.44% | 50.00% |
| Punjab Kings | 2008–2025 | 263 | 119 | 139 | 45.24% | 52.85% |
| Delhi Capitals | 2008–2025 | 266 | 118 | 140 | 44.36% | 52.63% |
Consequences of Sustained Underperformance in IPL
Financial Impact:
- Sponsorship revenue declines with consecutive poor seasons
- Merchandise sales drop correlates directly with team performance
- Franchise valuation growth lags behind successful competitors
Player Dynamics:
- Marquee player acquisition becomes difficult during auctions
- Established performers prefer franchises with winning records
- Young talent chooses teams offering better development infrastructure
Fan Metrics:
- Home match attendance shows a consistent decline
- Social media engagement drops with repeated playoff misses
- Season ticket renewals decrease year-over-year
Brand Positioning:
- Marketing partnerships require higher incentives
- Commercial value diminishes in sponsor negotiations
- Long-term brand equity suffers measurable damage
Recurring Patterns Among Underperforming IPL Teams
Auction Inefficiency:
- Budget allocation favors star names over squad balance
- Value identification fails in mid-tier price brackets
- Team requirement analysis lacks a systematic approach
Squad Depth Deficiencies:
- Backup options inadequate for injury or form issues
- Playing XI changes are limited by bench quality
- Tactical flexibility is restricted by a narrow talent pool
Leadership Instability:
- Captaincy changes exceed league averages
- Coaching staff turnover prevents strategy continuity
- Management-cricket operations alignment issues persist
Star Dependency:
- Performance collapses when key players fail
- Supporting cast lacks match-winning capability
- Excessive pressure on a limited number of performers
Domestic Development Gaps:
- Scouting network investment remains below requirements
- Uncapped player identification shows poor success rates
- Young player development programs underperform
Corrective Measures Struggling IPL Teams Can Apply in 2026
Core Stability:
- Retain 4-5 foundational players across multiple seasons
- Build a team culture around an established group
- Ensure leadership continuity beyond single campaigns
Analytics Integration:
- Deploy data-driven player selection protocols
- Implement advanced performance metrics analysis
- Analyze opposition patterns systematically
Youth Infrastructure:
- Establish comprehensive domestic scouting systems
- Create franchise-specific development academies
- Identify emerging talent before auction competition
Squad Balance:
- Prioritize all-rounder acquisitions for flexibility
- Build complete bowling attacks across all phases
- Extend batting capability through the lower order
Fan Ecosystem:
- Maintain engagement programs independent of results
- Leverage digital platforms for consistent interaction
- Develop loyalty mechanisms beyond on-field performance
FAQs
- Which team is considered the most unsuccessful historically?
Delhi Capitals hold the no 1 worst team in IPL position with 44.36% win rate and zero titles across 18 seasons.
- Which team is worst in IPL 2025?
Chennai Super Kings missed playoffs in 2025. However, historical data consistently ranks Delhi Capitals and Punjab Kings as the top 5 worst teams in IPL.
- Can unsuccessful teams achieve title success?
Royal Challengers Bengaluru won IPL 2025 after 18 years without a title. Strategic reforms and stable leadership enable performance turnarounds.
- Does auction strategy determine long-term success?
Auction decisions directly affect squad quality and depth. Data shows teams with systematic bidding approaches and retention policies outperform star-focused franchises.
- Are win percentages the only performance indicator?
Playoff qualification rates, title wins, and consistency metrics provide a complete performance assessment. Win percentage alone presents an incomplete analysis.
Conclusion:
Performance metrics identify the top 10 most unsuccessful ipl team in history through win rates and title droughts.
Delhi Capitals and Punjab Kings lead this category as the most unsuccessful teams in ipl history.
The strongest team in IPL, the Gujarat Titans, maintains 61.66% wins versus DC’s 44.36%.
Analysis reveals unsuccessful teams in ipl history patterns:
- Inefficient auction planning
- Leadership discontinuity
- Inadequate squad depth
- Star-centric strategies
Data confirms that the Most Unsuccessful IPL Team in History demonstrates specific structural weaknesses.
RCB’s 2025 title validates that systematic corrections reverse prolonged underperformance.
Also Check:
- Most Expensive Players in IPL History
- Highest CSK Scores In IPL History
- Highest MI Scores In IPL History
- Players With The Most Catches In IPL History
- Youngest Player In IPL History